Trace Data Settings Panel
Configure the traces display and data logging settings.
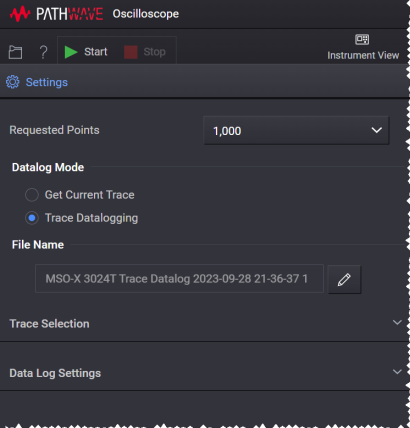
Requested Points
Set the number of points of trace data to be displayed, per trace, in the trace chart.
Datalog Mode
Configure the Oscilloscope application to either capture current trace data or log trace data over time.
Get Current Trace - Capture the current trace data from the oscilloscope and display it in the Oscilloscope application window. Note that this operation captures the current trace data without initiating a new measurement.
Trace Datalogging - Log the trace data over time.
Data Log Name
The default file name consists of the oscilloscope model number followed by "Trace" (for Get Current Trace)/"Trace Datalog"(for Trace Datalogging), the date, current time, and a numeric index. For example, <model> Trace 2021-12-20 11-40-26 31 – December 20, 2021 at 11:40:26 a.m. with a numeric index of 31.
For example – C:\Users\<user_name>\Documents\Keysight\PathWaveOscilloscope\Data Logs\.
To change the default name, click ![]() to open the file name editor. You can edit the prefix name and also have the option to include or exclude the date, current time, and numeric index. The date is in the form YYYY-MM-DD and the time is in the form HH-mm-ss (24-hour time format). For example, Trace 2021-12-20 11-40-26 31 – December 20, 2021 at 11:40:26 a.m. with a numeric index of 31.
to open the file name editor. You can edit the prefix name and also have the option to include or exclude the date, current time, and numeric index. The date is in the form YYYY-MM-DD and the time is in the form HH-mm-ss (24-hour time format). For example, Trace 2021-12-20 11-40-26 31 – December 20, 2021 at 11:40:26 a.m. with a numeric index of 31.
- If included, the date, time, and numeric index fields are automatically updated with each subsequent data log operation from this application.
- The date and time fields are based on your computer's internal clock setting.
- The data log is stored with a .IVIF file extension.
Trace Selection
Select the desired oscilloscope traces to be displayed on the trace chart. See Select Displayed Traces.
Datalog Settings
Configure the instrument for trace data logging. These settings are only available when Datalog Mode is set to Trace Datalogging. See Data Logging Settings.